
[Data Science] project

🏆반드시 들어가야 하는 내용
- 지역에 따라서 선호하는 게임 장르가 다를까 라는 질문에 대답을 하셔야합니다.
- 연도별 게임의 트렌드가 있을까 라는 질문에 대답을 하셔야합니다.
- 출고량이 높은 게임에 대한 분석 및 시각화 프로세스가 포함되어야 합니다.
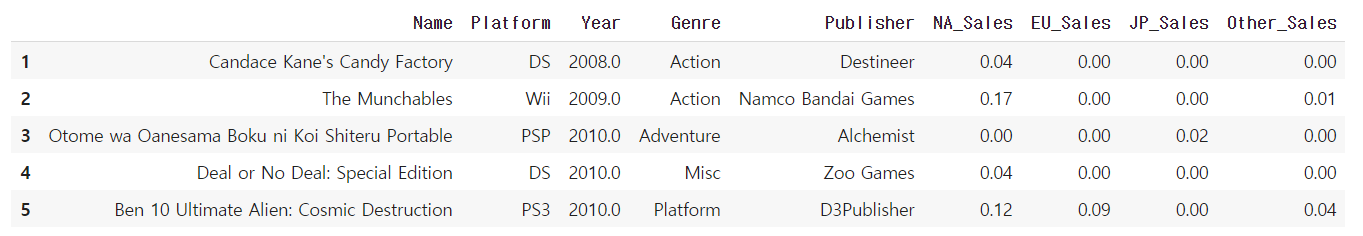
※Data Description
- Name : 게임의 이름입니다.
- Platform : 게임이 지원되는 플랫폼의 이름입니다.
- Year : 게임이 출시된 연도입니다.
- Genre : 게임의 장르입니다.
- Publisher : 게임을 제작한 회사입니다.
- NA_Sales : 북미지역에서의 출고량입니다.
- EU_Sales : 유럽지역에서의 출고량입니다.
- JP_Sales : 일본지역에서의 출고량입니다.
- Other_Sales : 기타지역에서의 출고량입니다.
목표: 다음 분기에 어떤 게임을 설계해야 할까?
- 최근 5년동안 게임 장르별로 추이를 보면서 성적이 떨어진것이 무엇이고 상승하고 있는게 무엇인지 확인!
- 이 장르가 신선해서 특히 해당 장르의 어떤 게임이 이 장르의 게임에 큰 기여를 해서 상승 곡선 그래프를 만들고 있다.
- 어떤 게임이 하락세를 타고 유저도 많이 빠지고 있어, 그래서 전체적인 그 장르가 하향 곡선을 그리고 있다.
코드
1. 전처리
import pandas as pd
import numpy as np

#1.전처리
df = pd.read_csv('/content/drive/MyDrive/vgames2.csv')

#데이터 타입 확인
df.dtypes #sales feature type을 모두 numerical로 변환해야겠다.

#output
Unnamed: 0       int64
Name            object
Platform        object
Year           float64
Genre           object
Publisher       object
NA_Sales        object
EU_Sales        object
JP_Sales        object
Other_Sales     object
dtype: object

#결측값 확인
#dataframe.isna : 결측 값은 True를 그 외의 값은 False를 반환, dataframe.notna : 결측 값은 False를 그 외에는 True 반환
df.isnull().sum() # Year, Genre, Publisher에 결측값 존재함을 확인

#output
Unnamed: 0       0
Name             0
Platform         0
Year           271
Genre           50
Publisher       58
NA_Sales         0
EU_Sales         0
JP_Sales         0
Other_Sales      0
dtype: int64

#Year 컬럼 전처리

df_Year_confirm = df[df.Year<1980]
df_Year_confirm[df_Year_confirm.Year >50]
df_Year_confirm[df_Year_confirm.Year >50].Year.unique() #output: array([97., 96., 98., 86., 95., 94.]) -> 1900년도의 형태로 바꿔주자.
df[df.Year<17].Year.unique() #output: array([ 9., 11., 15.,  3.,  6.,  8.,  1.,  5.,  4., 10.,  7., 16., 14.,2., 13.,  0., 12.])
def change_year(x):
  if x < 1980 and x >50 :
    return x + 1900
  elif x < 17:
    return x + 2000
  else:
    return x

df.Year = df.Year.apply(change_year)
df.Year.unique()

#output
array([2008., 2009., 2010., 2005., 2011., 2007., 2001., 2003., 2006.,
       2014., 2015., 2002., 1997., 2013., 1996., 2004., 2000., 1984.,
       1998., 2016., 1985., 1999., 1995., 1993., 2012., 1987., 1982.,
       1994., 1990., 1992., 1991., 1983., 1988., 1981., 1989., 1986.,
       2017., 1980., 2020.])

#결측치가 Year, Genre, Publisher 컬럼에 존재한다.
#만약, 결측치가 있는 데이터의 게임과 동일한 게임이 존재한다면 결측치의 장르를 알아 낼 수 있다고 판단.
#장르 컬럼의 결측치값 변경

for name in df[df['Genre'].isnull()]['Name'].values:
  if (df[df['Name']==name].Genre).shape[0] > 1:
    index = list(df[df['Name']==name].index.values)
    for value in df[df['Name']==name].Genre.values:
      if type(value) == str:
        df.loc[index,'Genre'] = pd.Series([value]*len(df[df['Name']==name].Genre.values)).values
        break
  else:
    index = list(df[df['Name']==name].index.values)
    df = df.drop(index,axis = 0)


#Publisher column에 결측값을 가진 행의 Name 컬럼에 있는 데이터와 동일한 데이터가 있는지 확인하고 만약 있다면 그 게임 이름으로 대체했다.
df[df['Publisher'].isnull()]['Name'].value_counts()


for value in df[df['Publisher'].isnull()]['Name'].values:
  if df[df['Name']==value].shape[0] > 1:
    index = list(df[df['Name']==value].index.values)
    for name in df[df['Name']==value].Name.values:
      if type(name) == str:
        df.loc[index,'Publisher'] = pd.Series([name]*df[df['Name']==value].shape[0]).values
        break
  else:
    index = list(df[df['Name']==value].index.values)
    df = df.drop(index,axis = 0)


# 결측값이 포함되어 있는 행 제거
df = df.dropna()

# 인덱스 정렬, 및 Unnamed 컬럼 제거
df = df.drop('Unnamed: 0',axis = 1)
df.index = np.arange(1,df.shape[0]+1)

#결측치 재확인
df.isnull().sum()
#output:
Name           0
Platform       0
Year           0
Genre          0
Publisher      0
NA_Sales       0
EU_Sales       0
JP_Sales       0
Other_Sales    0
dtype: int64

#sales 컬럼들 전처리
#컬럼에 있는 k, m 처리

sales = df.columns[5:].values

#k,m -> 10*3, 10*6 치환
for sale in sales:
  df[sale] = (df[sale].replace(r'[KM]+$', '', regex=True).astype(float) * \
              df[sale].str.extract(r'[\d\.]+([KM]+)', expand=False).fillna(1).replace(['K','M'], [10**3, 10**6]).astype(int))
전처리 완료된 데이터 확인
2. 분석
- 가정
- 옛날에는 게임 개발이 많이 안되서 지역적인 특색이 거의 없을 수 있다.
- 1980~2000년대 까지는 게임 개발 시스템 발전이 없다. 그래서 장르적인 발전이 많이 없었다. 미국, 유럽, 일본의 유행하는 장르 거의 비슷할 것이다.
- 2000년도 중반 후반에는 게임 장르도 많아지고 게임 회사 많아지고 이런거를 발견하고 그러면서 동시에 지역적인 특색이 이렇게 변했다.
- 사전 조사
-
한국의 모바일 게임 2000년도 중반부터 생겼다. 이후 2010년 초중반 완전히 모바일로 바뀌게 되었다. 특히 한,중,일의 모바일 or pc에서 MMORPG, 뽑기게임이 대세였고, 미국에서는 퍼즐 장르가 인기 있었다.
-
게임이 점점 발전되면서 장르적인 특징 or 각 플랫폿마다 장점이 되는 게임 장르가 있다.
- consol에서는 다이나믹한 장르가 유리하다. 조이스틱 같은 인터페이스를 통해 게임을 하기 때문에 다이나믹한 게임에 유리하다. 쉽게 생각하면 축구 게임인 ‘위닝’을 생각하면 편하다. 즉, pc의 키도브 누르는 것보다 좀 더 역동적이라고 생각하면 된다.
- 모바일에서는 단순한 게임(자동 사냥 지원이 되는 게임 or 뽑기 게임 등)이 유리하다. 화면이 작기 때문!
- pc에서는 전략 게임이 유리하다. 마우스를 활용해 더 많은 작업을 할 수 있기 때문이다.
-
1. 지역에 따라서 선호하는 게임 장르가 다를까?
- 유럽/북미/일본/기타 지역에 대한 각 연도별로 선호하는 게임 장르 top3 분석! (지역별 출고량 기준 비교)
#1.북미
na_genre = dict()
favorite_na_genre = []

for year in years:
  top3_na = []
  if year == 2020.0:
    if (df[df['Year']==year].sort_values('NA_Sales',ascending=False).NA_Sales.values[0]) == 0.0:
      continue
    else:
      top3_na.append((df[df['Year']==year].sort_values('NA_Sales',ascending=False).Genre.values[0]))
      na_genre[year] = top3_na
      favorite_na_genre.append((df[df['Year']==year].sort_values('NA_Sales',ascending=False).Genre.values[0]))
  elif year > 2012.0:
    for _,_,_,genre,_,topvalue,_,_,_ in df[df['Year']==year].sort_values('NA_Sales',ascending=False).head(3).values:
      if topvalue == 0.0:
        break
      else:
        top =  genre
        favorite_na_genre.append(top)
        top3_na.append(top)
        na_genre[year] = top3_na

print('\n 북미 지역 탑3 장르\n')
for key in na_genre.keys():
  print('{0} : {1}'.format(key,na_genre[key]))

#2.유럽
eu_genre = dict()
favorite_eu_genre = []

for year in years:
  top3_eu = []
  if year == 2020.0:
    if (df[df['Year']==year].sort_values('EU_Sales',ascending=False).EU_Sales.values[0]) == 0.0:
      continue
    else:
      eu_genre[year] = (df[df['Year']==year].sort_values('EU_Sales',ascending=False).Genre.values[0])
  elif year > 2011.0:
    for _,_,_,genre,_,_,topvalue,_,_ in df[df['Year']==year].sort_values('EU_Sales',ascending=False).head(3).values:
      if topvalue == 0.0:
        break
      else:
        top =  genre
        favorite_eu_genre.append(top)
        top3_eu.append(top)
        eu_genre[year] = top3_eu
print('\n 유럽 지역 탑3 장르\n')
for key in eu_genre.keys():
  print('{0} : {1}'.format(key,eu_genre[key]))

#3.일본
jp_genre = dict()
favorite_jp_genre = []

for year in years:
  top3_jp = []
  if year == 2020.0:
    if (df[df['Year']==year].sort_values('JP_Sales',ascending=False).JP_Sales.values[0]) == 0.0:
      continue
    else:
      jp_genre[year] = (df[df['Year']==year].sort_values('JP_Sales',ascending=False).Genre.values[0])
  elif year > 2012.0:
    for _,_,_,genre,_,_,_,topvalue,_ in df[df['Year']==year].sort_values('JP_Sales',ascending=False).head(3).values:
      if topvalue == 0.0:
        break
      else:
        top3_jp.append(genre)
        favorite_jp_genre.append(genre)
        jp_genre[year] = top3_jp

print('\n 일본 지역 탑3 장르\n')
for key in jp_genre.keys():
  print('{0} : {1}'.format(key,jp_genre[key]))

#4.기타
other_genre = dict()
favorite_other_genre = []

for year in years:
  top3_other = []
  if year == 2020.0:
    if (df[df['Year']==year].sort_values('Other_Sales',ascending=False).Other_Sales.values[0]) == 0.0:
      continue
    else:
      top3_other.append((df[df['Year']==year].sort_values('Other_Sales',ascending=False).Genre.values[0]))
      other_genre[year] = top3_other
      favorite_other_genre.append((df[df['Year']==year].sort_values('Other_Sales',ascending=False).Genre.values[0]))
  elif year > 2012.0:
    for _,_,_,genre,_,_,_,_,topvalue in df[df['Year']==year].sort_values('Other_Sales',ascending=False).head(3).values:
      if topvalue == 0.0:
        break
      else:
        top3_other.append(genre)
        favorite_other_genre.append(genre)
        other_genre[year] = top3_other

print('\n 기타 지역 탑3 장르\n')
for key in other_genre.keys():
  print('{0} : {1}'.format(key,other_genre[key]))

#output:
북미 지역 탑3 장르

2020.0 : ['Simulation']
2016.0 : ['Shooter', 'Sports', 'Action']
2015.0 : ['Platform', 'Action', 'Action']
2014.0 : ['Shooter', 'Sports', 'Role-Playing']
2013.0 : ['Action', 'Shooter', 'Racing']

 유럽 지역 탑3 장르

2016.0 : ['Role-Playing', 'Sports', 'Shooter']
2015.0 : ['Sports', 'Platform', 'Action']
2014.0 : ['Shooter', 'Shooter', 'Adventure']
2013.0 : ['Sports', 'Platform', 'Action']
2012.0 : ['Action', 'Misc', 'Action']

 일본 지역 탑3 장르

2017.0 : ['Role-Playing', 'Action', 'Role-Playing']
2016.0 : ['Action', 'Action', 'Role-Playing']
2015.0 : ['Role-Playing', 'Role-Playing', 'Adventure']
2014.0 : ['Fighting', 'Fighting', 'Role-Playing']
2013.0 : ['Role-Playing', 'Role-Playing', 'Action']

 기타 지역 탑3 장르

2020.0 : ['Simulation']
2016.0 : ['Shooter', 'Sports', 'Shooter']
2015.0 : ['Role-Playing', 'Action', 'Action']
2014.0 : ['Role-Playing', 'Action', 'Sports']
2013.0 : ['Racing', 'Shooter', 'Strategy']
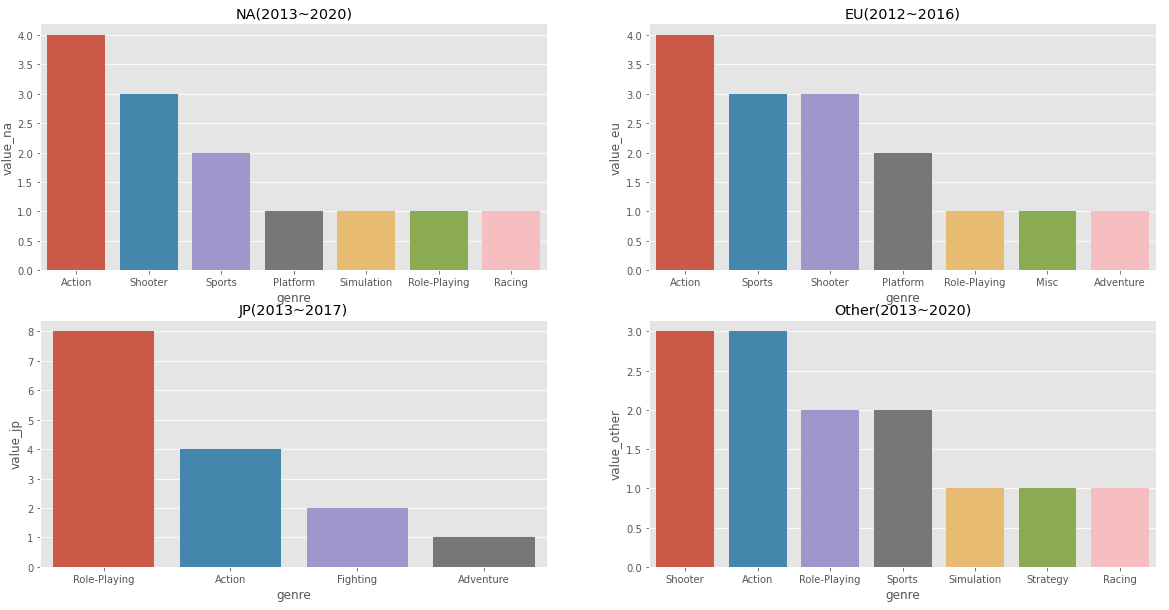
- 각 지역별 최근 5년간의 top 3 장르를 수치화해서 표현함.
- 북미 지역에서 가장 많이 선호된 장르는 Action
- 유럽 지역에서 가장 많이 선호된 장르는 Action
- 일본 지역에서 가장 많이 선호된 장르는 Role-Playing
- 기타 지역에서 가장 많이 선호된 장르는 Shooter & Action
- 그래프만 보아도 지역별로 선호되는 장르가 비슷하다는 것을 알 수 있었다.
결론: 지역에 따라 선호하는 게임 장르가 비슷하다.
2. 연도별 게임의 트렌드가 있을까?
- 질문에서 말하는 게임 트렌드? - 플랫폼, 장르
- 연도별 게임의 트렌드! -> 게임의 트렌드는 장르 or 플랫폼도 가능. 엮어서 이쪽 플랫폼에서는 이쪽 장르가 대두된다. 콘솔게임으로는 이쪽 장르를 많이 개발되고 있는거 같다.
#figure 사이즈 조정
fig = plt.figure(figsize=(30, 20))

sale = ['NA_Sales','EU_Sales','JP_Sales','Other_Sales']
x_value = 10

for sal,ax,val,year in zip(sale*3,[fig.add_subplot(4,4,n) for n in range(1,13,1)],['value_na','value_eu','value_jp','value_other']*3,[2016.0,2016.0,2016.0,2016.0
                                                                                                                                      ,2015.0,2015.0,2015.0,2015.0
                                                                                                                                      ,2014.0,2014.0,2014.0,2014.0]):

  series = {'genre':df[df['Year']==year].Platform
  .value_counts().index,'value_na':df[df['Year']==year].Platform.value_counts().values
          ,'value_eu':df[df['Year']==year].Platform.value_counts().values
          ,'value_jp':df[df['Year']==year].Platform.value_counts().values
          ,'value_other':df[df['Year']==year].Platform.value_counts().values}

  local_df = pd.DataFrame(series)
  g = sns.barplot(data = local_df, x = 'genre',y= val,ax=ax)
  index = []
  for platform in df[df['Year']==year].sort_values(sal,ascending=False).Platform[:3]:
    index.append(np.where(np.array(['PS4','PSV','3DS','XOne','PS3','PC','X360','WiiU','Wii','PSP']) == platform)[0])
  for a,b,c,d in zip(index,df[df['Year']==year].sort_values(sal,ascending=False).Genre[:3].values,[1,2,3],[1,3,6]):
    v=local_df.loc[a,:][val]
    v = v - (d*x_value)
    if v.values < 0:
      v = local_df.loc[a,:][val]
    g.text(x=a,y=v,s=(str(c)+'\n'+b),horizontalalignment='center')

    ax.set(ylabel=val,title=val[6:]+'({0})'.format(int(year)))

plt.show()

#output:
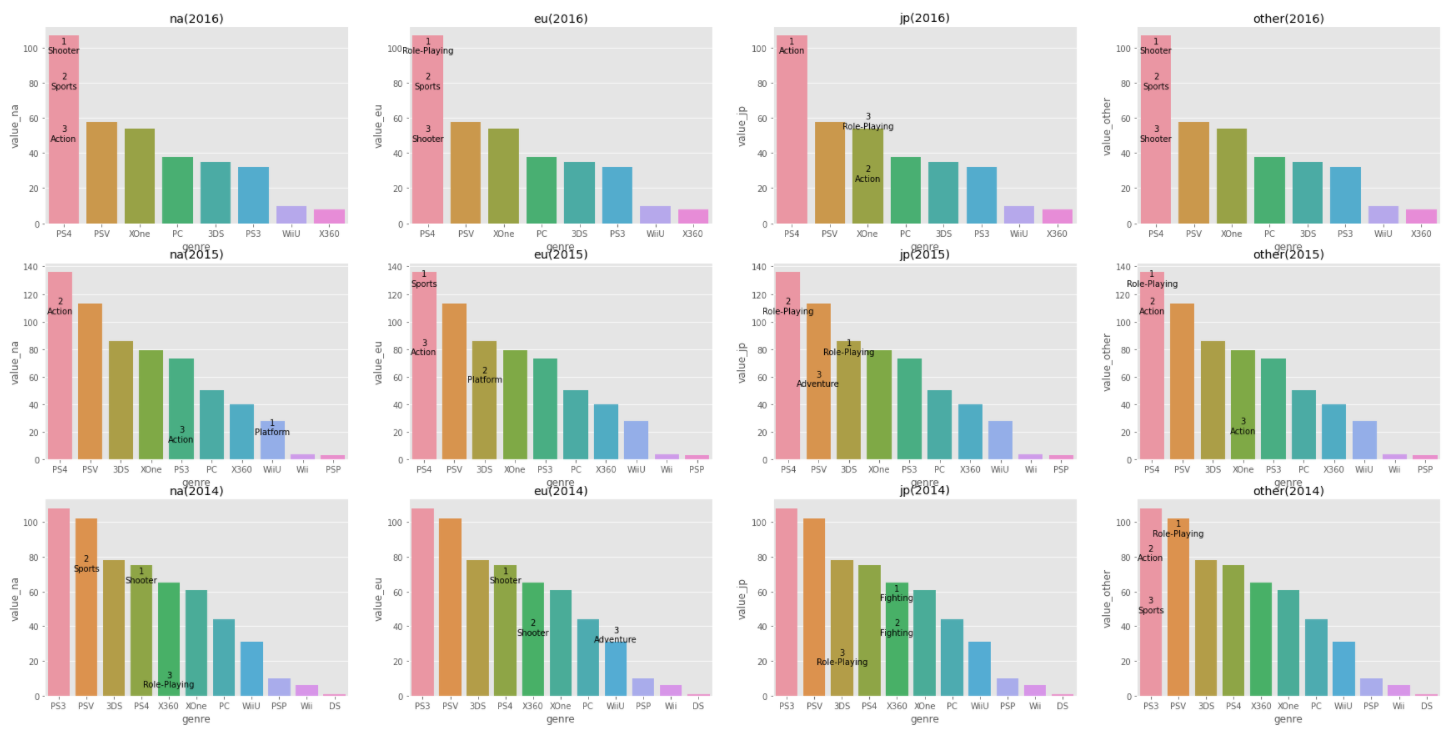
- 특정 연도(2014,2015,2016)에 출시된 게임들의 각 플랫폼의 수를 수집하고 시각화하였다. 또한 해당 연도별 지역마다 출고량 1~3위에 해당하는 게임의 장르를 해당 플랫폼에 표시했다.
- 특정 연도별로 플랫폼의 수를 수치화하고 시각화한 것을 보아 console platform이 가장 인기있다는 것을 확인할 수 있었다. 즉, 게임의 트렌드(플랫폼)가 console로 많이 돌아섰다는 것을 확인할 수 있었다.
- 특히나 2016년도에는 모든 지역에서 출고량의 top 3 게임이 모두 PS4인 만큼 console platform의 트렌드라는 것을 확인할 수 있었다.
- 또한 console 게임의 특성상 다이나믹한 게임들이 많다는 것을 top 3 게임의 장르를 확인하면서 알 수 있었다.
- 주요 top 3 게임
- shooter : 적의 공격을 피하며 무기를 쏘는 게임
- Action : 일정한 스토리에/배경에 따라 실시간으로 캐릭터의 행동을 버튼 등을 통해 직접 조작하는 비디오 게임
- Sports : 축구, 농구 게임.
- 주요 top 3 게임
결론
- 게임 트렌드 -> 플랫폼
- 연도별 게임의 트렌드는 console 플랫폼의 게임이라는 것을 확인할 수 있었다.
- 게임 트렌드 -> 장르
- 연도별 전체 데이터의 장르의 수와 각 지역별로 출고량을 기준으로 장르에 대한 트렌드를 확인해보려 했다.
- 연도별 전체 지역에 출시된 게임의 순수 장르의 수를 파악해보니 아래와 같음을 확인할 수 있었다.
- 1980 : Misc
- 1981 ~ 1983 : Action
- 1984 ~ 1985 : Puzzle
- 1986 : Platform
- 1987 : Sports
- 1988 : Platform
- 1989 : Puzzle
- 1990 : Platform
- 1991 : Sports
- 1992 : Fighting
- 1993 : Platform
- 1994 ~ 2002 : Sports
- 2003 ~ 2016 : Action
- 2017 : Role-Playing
- 2020 : Simulation
- Platform과 Puzzle이 계속 교차로 많이 출시되다가 1994 ~ 2002년까지는 Sports가 2013 ~ 2016까지는 Action 장르의 게임이 많이 출시되었다는 것을 확인할 수 있었고 이러한 게임의 주요 플랫폼이 console(ps4,ps3,xone,wiiu)인 것을 확인할 수 있었다(위의 다른 문제 해결에서). 역시 console 게임이 장르를 보면 알 수 있지만 역동적인 게임이 유리하다는 것을 볼 수 있다.
- 출시된 장르의 수와는 달리 각 지역마다 출고량 1위인 장르는 다르다는 것을 보고 2016년도 국내 배틀로얄 게임 열풍을 불러온 배틀그라운드 처럼 갑작스럽게 인기의 급상승으로 아래와 같은 결과가 나왔나?라는 생각을 해볼 수 있었다.
from collections import defaultdict

years = sorted(df.Year.unique())
year_genres = defaultdict(list)

#해마다 장르의 수로 가장 인기있는 장르라고 판단했고 해당 연도와 값을 딕셔너리로 표현 (장르의 수로 연도별 게임의 트렌드 파악) -> 출고량을 기준으로 바꿔야함.
for year in years:
  favorites = []
  for favorite in df[df['Year']==year].Genre.value_counts().index[df[df['Year']==year].Genre.value_counts()==df[df['Year']==year].Genre.value_counts().max()].values:
    favorites.append(favorite)
  year_genres[year].append(favorites)
  for sale in ['NA_Sales','EU_Sales','JP_Sales','Other_Sales','Total_Sales']:
    if df[df['Year']==year].sort_values(sale,ascending=False)[sale].iloc[0] <=0:
      year_genres[year].append('No sale')
    else:
      year_genres[year].append(df[df['Year']==year].sort_values(sale,ascending=False).Genre.iloc[0])
  print('\n--------------------{0}-------------------\n'.format(year))
  print('모든 지역에서 가장 많이 출시된 게임 장르(게임 장르 수): {0}'.format(year_genres[year][0][0]))
  print('북미에서 가장 많이 출시된 게임 장르(출고량): {0}'.format(year_genres[year][1]))
  print('유럽에서 가장 많이 출시된 게임 장르(출고량): {0}'.format(year_genres[year][2]))
  print('일본에서 가장 많이 출시된 게임 장르(출고량): {0}'.format(year_genres[year][3]))
  print('기타 지역에서 가장 많이 출시된 게임 장르(출고량): {0}'.format(year_genres[year][4]))
  print('모든 지역에서 가장 많이 출시된 게임 장르(출고량): {0}'.format(year_genres[year][5]))
#output: 여기를 클릭하면 출력 결과 확인 가능합니다.
- 의문?
- 해당 연도에 출시된 게임의 특정 장르(가장 많이 출시된 장르)와 출고량이 가장 높은 게임의 장르가 다른 이유는 무엇일까?
- 해결: 작년의 영향으로 특정 장르가 많이 출시되었지만 갑자기 새로운 장르의 게임이 인기가 급상승하는 경우가 있을 것으로 판단.
- 해당 연도에 출시된 게임의 특정 장르(가장 많이 출시된 장르)와 출고량이 가장 높은 게임의 장르가 다른 이유는 무엇일까?
3. 출고량이 높은 게임에 대한 분석 및 시각화 프로세스가 포함되어야 합니다.
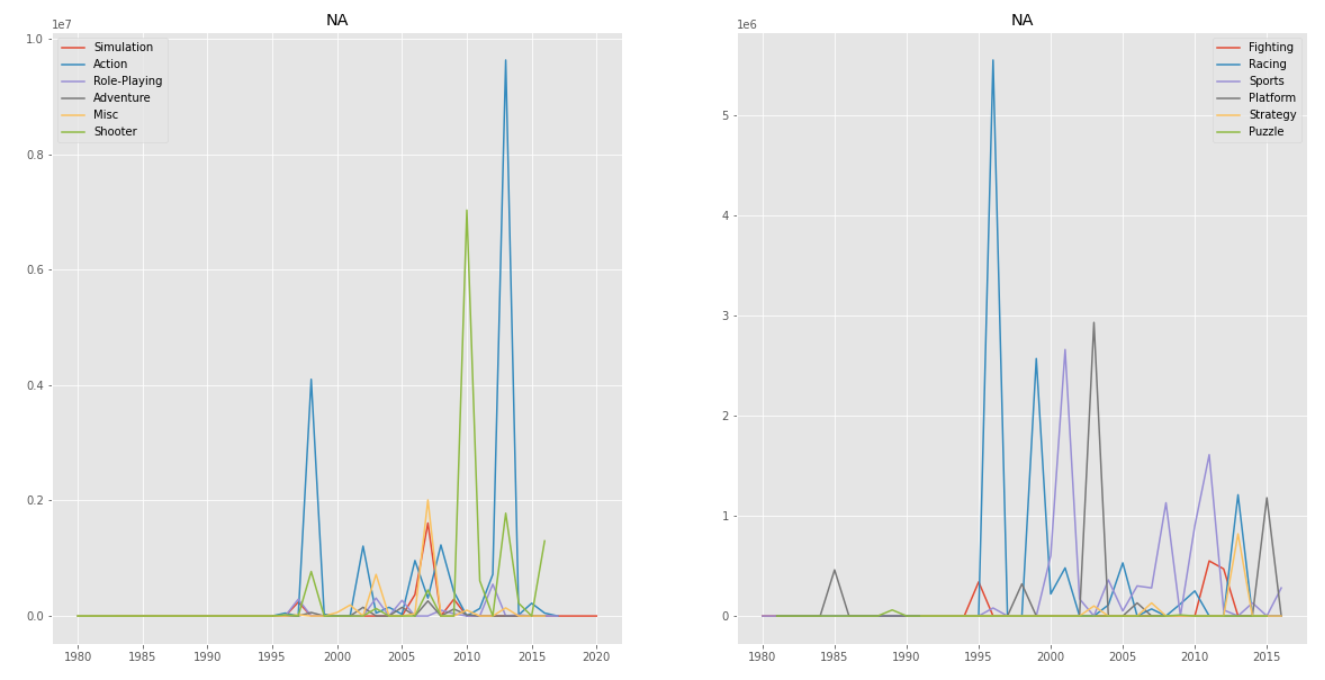
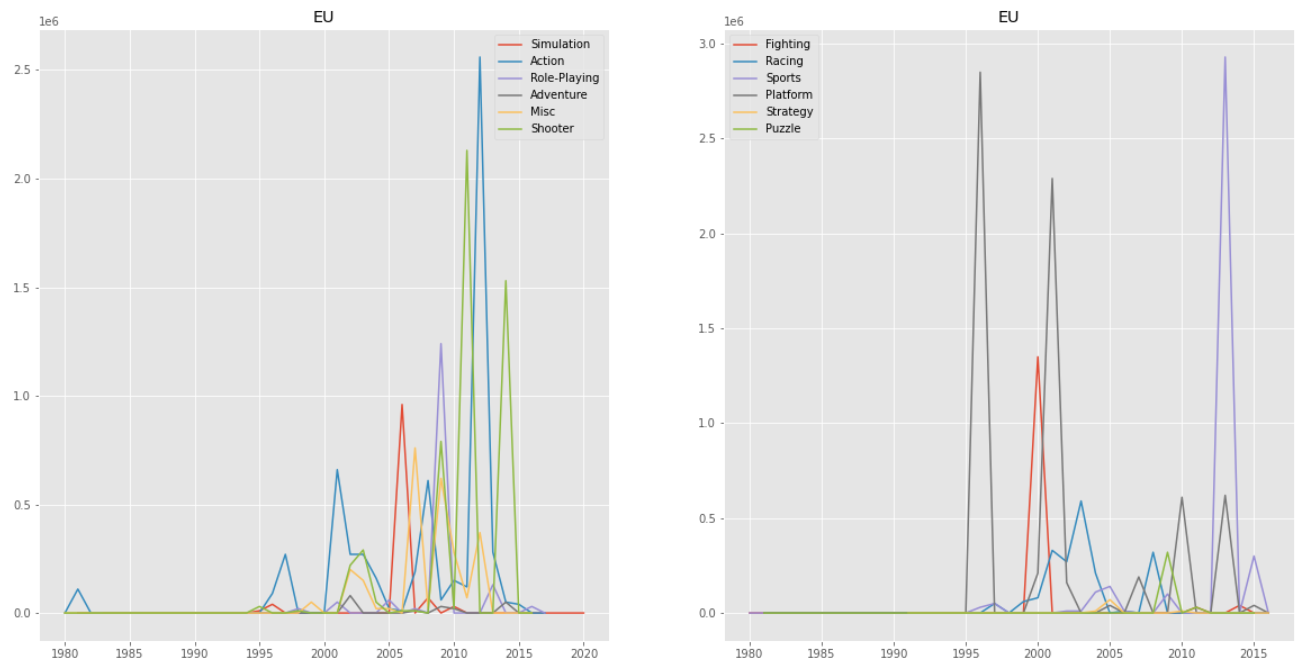
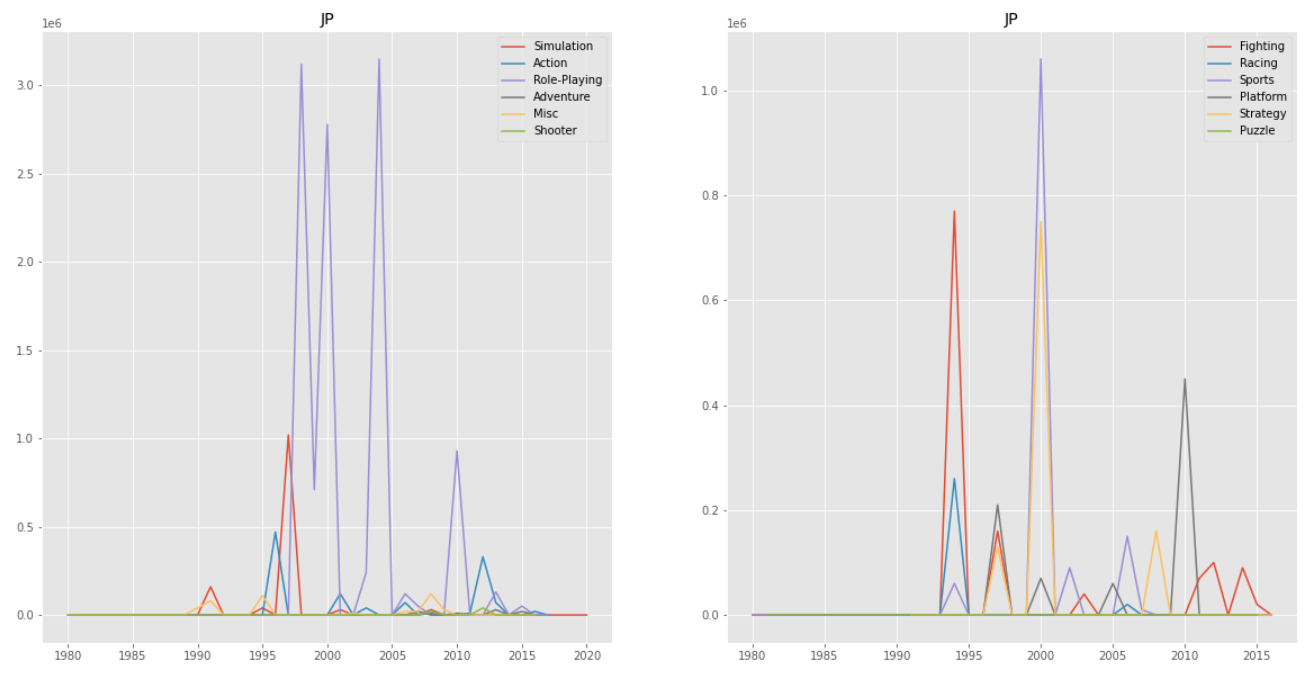
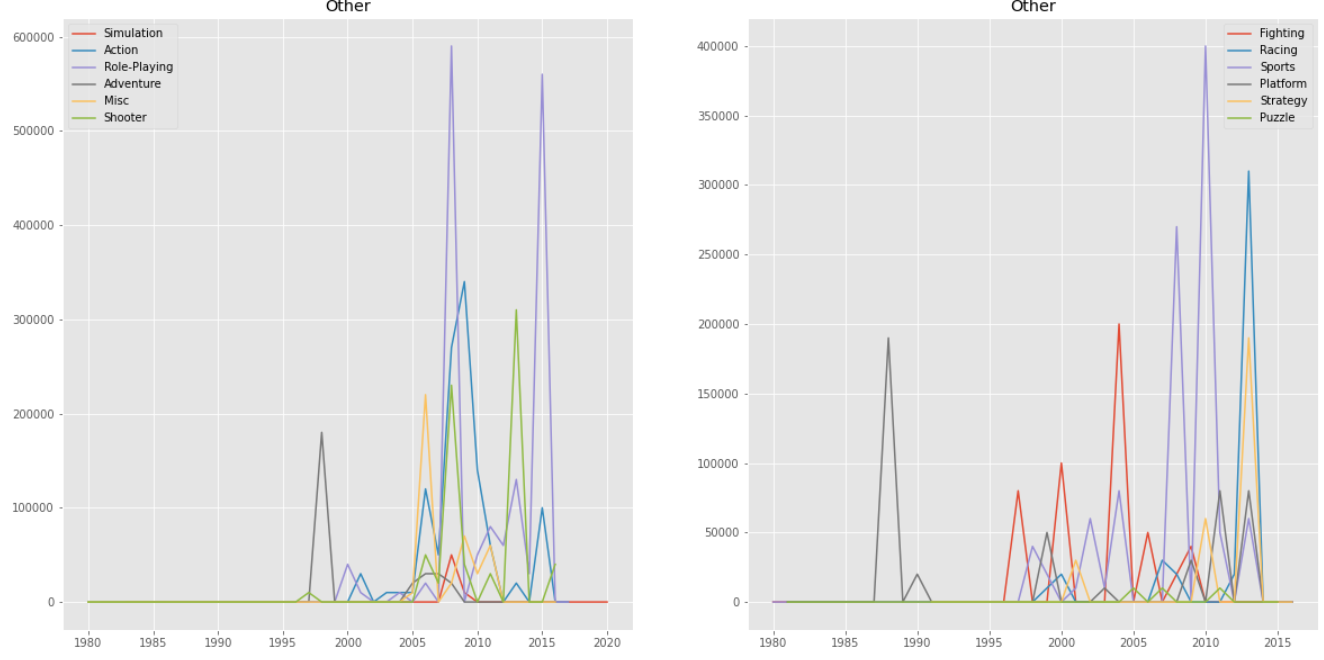
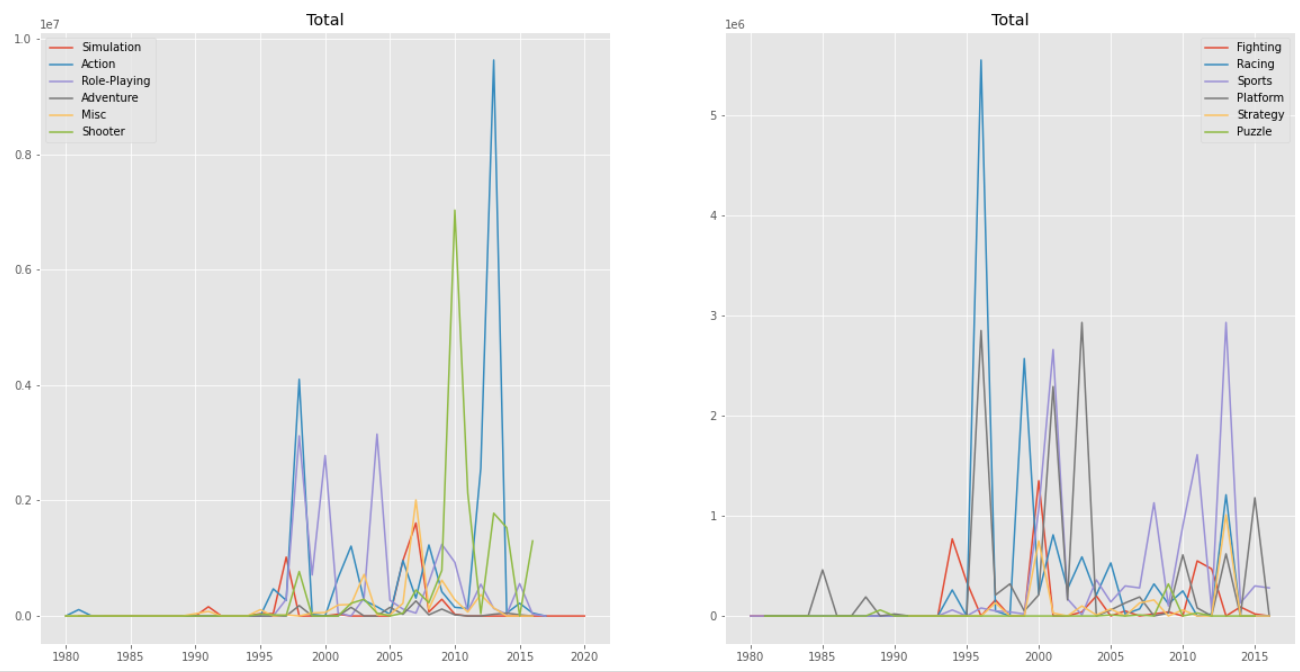
- 해당 연도의 각 장르별 가장 높은 출고량 시각화 - 각 지역별로 시각화 시켜보자.
- 해당 연도별로 출고량을 기준으로 각 장르의 인기를 시각화해서 확인할 수 있었다.
fig = plt.figure(figsize=(40, 100))

for h,ax, sale in zip([j for j in range(1,11)]
                      ,[fig.add_subplot(10,2,i) for i in range(1,11)]
                      ,['NA_Sales','NA_Sales','EU_Sales','EU_Sales',
                                                                    'JP_Sales','JP_Sales','Other_Sales','Other_Sales',
                                                                    'Total_Sales','Total_Sales']):
  for i,index in enumerate(df.Genre.unique()):
    if (i<6) & (h%2):
      x = []
      y = []
      for yy in df.Year.unique():
        if index in df[df['Year']==yy].Genre.unique() :
          x.append(yy)
          y.append(df[(df['Year']==yy) & (df['Genre']==index)].sort_values(sale,ascending=False)[sale].iloc[0])
      ax.plot(x,y,label=index)
      ax.legend()
      ax.set_title(sale)
    elif (i>= 6) & ~(h%2):
      x = []
      y = []
      for yy in df.Year.unique():
        # print(yy)
        if index in df[df['Year']==yy].Genre.unique() :
          x.append(yy)
          y.append(df[(df['Year']==yy) & (df['Genre']==index)].sort_values(sale,ascending=False)[sale].iloc[0])
      ax.plot(x,y,label=index)
      ax.legend()
      ax.set_title(sale)


plt.show()

#output:
결론
-
북미 지역에서는 Shooter, Action가 인기가 점점 있어왔고, Racing 장르가 점차 인기가 떨어진것을 확인할 수 있다. 2016년 이후에는 데이터의 부족으로 인해 확인하기 어렵다.
-
유럽지역에서는 북미 지역과 마찬가지로 Shooter, Action, Sports가 인기가 있었고 Platform의 인기가 서서히 식고 있는 것을 확인할 수 있었다.
-
일본 지역에서는 1980~1982년 사이에는 게임 자체에 대한 사람들의 인식이 없었다. 이후, 2000년도 전과 후에는 Role-Playing, Racing이 인기가 많았고 해가 지나갈수록 모든 장르의 인기가 비슷해지는 것을 확인할 수 있었다.
-
기타 지역에서는 Adventure, Racing, Sports, Strategy가 인기가 점점 많아지고 Action 장르가 2006~2010년 사이에 크게 인기가 있었다가 이후에 점차 인기가 조금씩 떨어지는 것을 확인할 수 있었다.
-
북미, 유럽, 일본, 기타 지역을 모두 합산한 전체 지역을 보면 그래프 자체가 북미 지역의 영향을 많이 받은 것처럼 보인다.
4. 추가 데이터 분석
- 최근 3년 데이터를 뽑아내서 이 쪽 장르가 대두되고 오히려 이 쪽 장르는 줄어들었다. 지금까지는 인기가 있었는지는 모르겠지만 점점 더 하락세를 띌거 같다.
- 최근 3년의 데이터를 뽑아서 장르별로 출고량 파악!?
- 지역별로 파악하는 것이 중요할 듯!
- 특정 장르에서 가장 많이 팔린 게임을 필두로 이쪽 장르가 지금 점점 더 상승세를 띄고 있다. 시각화!
- 특정 장르에서 가장 많이 팔린 게임을 필두로 이쪽 장르가 지금 점점 더 상승세를 띄고 있다.
-
각 연도별로 분석하는게 좋다. 또는 최근 5년? 아니면 연도별로 특히 갑자기 장르가 바뀌는 기점이 있을까?
-
2000년도 전과 2000년도 중후반 게임 회사의 수, 장르의 종류, 플랫폼의 종류의 변화를 보면서 게임에 대한 관심, 개발등의 성장으로 인해 지역적인 특색이 어떻게 달라졌는지 확인
-
ex) 2019년에는 배틀로얄 같은 게임이 많이 나왔다. 배틀 그라운드를 필두로 많이 개발됨. 처음에 포트나이트도 배틀로얄 게임이 아니었는데 배틀그라운드의 영향으로 배틀로얄 게임이 됨.
-
기존 게임에 배틀로얄 형식을 넣음.
-
우리나라는 모바일 게임 RPG가 많이 생김. 2017~ 2019는 일본 - 모바일 가차, 미국 - 퍼즐
# 2000년도 전의 게임 회사의 수, 장르의 수, 플랫폼의 종류 파악
len(df[df['Year'] < 2000.0].Publisher.unique()),len(df.Publisher.unique()),len(df[df['Year'] < 2000.0].Platform.unique()),len(df.Platform.unique()) #output:(211, 582, 18, 31)
#2000년도 전과 후를 비교해봤을 때 게임 회사의 수, 플랫폼의 수가 대략 2배정도의 차이가 있다는 것을 확인할 수 있었다.
#더 나아가서 연도별로 게임 회사의 수, 장르의 수, 플랫폼의 종류 파악!
years = df.Year.unique()
ma_df = df.copy()
fig = plt.figure(figsize=(25,10))
platform = [len(ma_df[ma_df['Year']==year].Platform.unique()) for year in years]
genre = [len(ma_df[ma_df['Year']==year].Genre.unique()) for year in years]
publisher = [len(ma_df[ma_df['Year']==year].Publisher.unique()) for year in years]
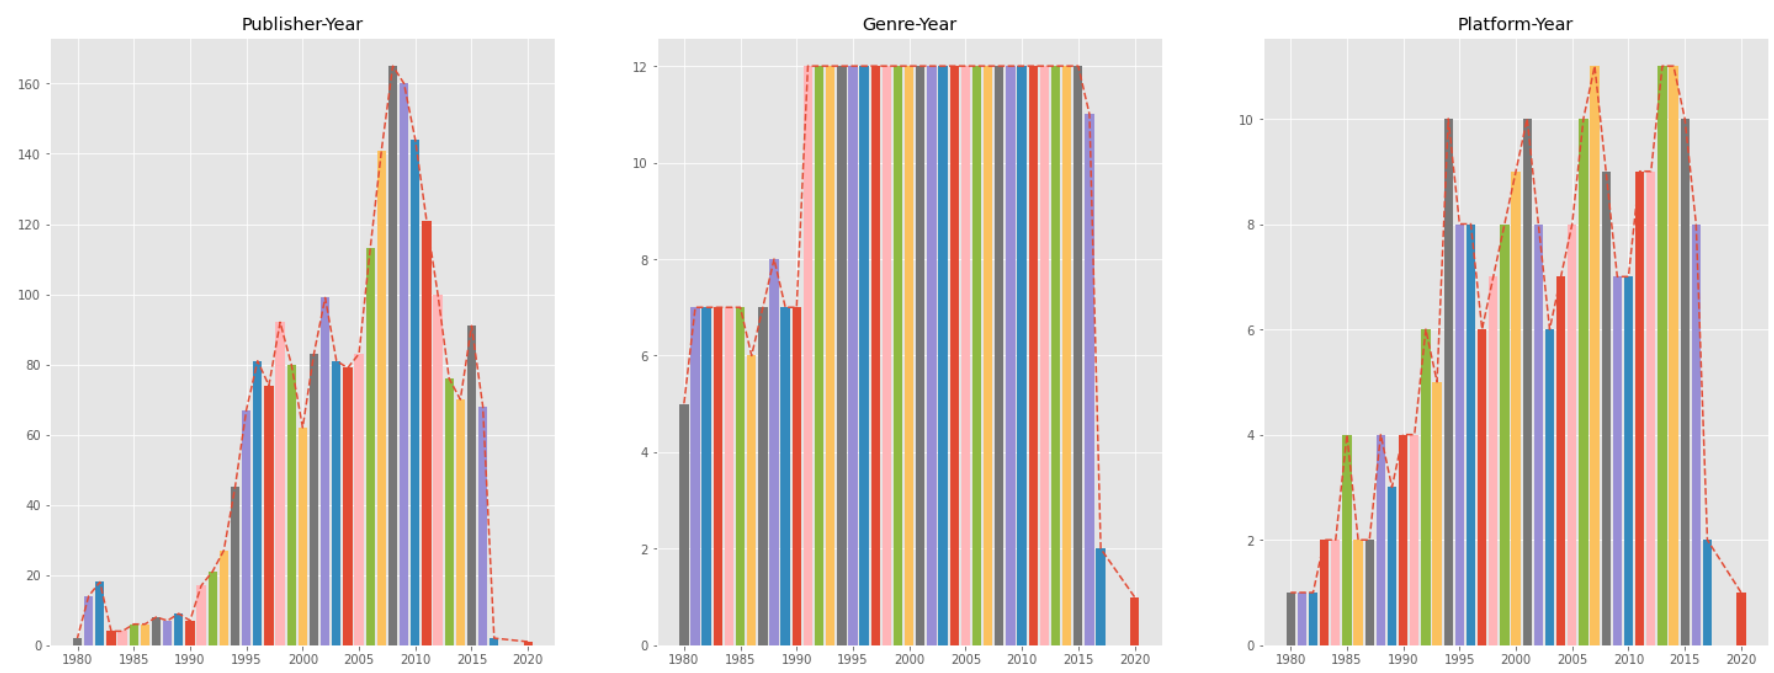
for ax,columns,column,title in zip([fig.add_subplot(2,3,i) for i in range(1,4)],['Publisher','Genre','Platform'],[publisher,genre,platform],['Publisher-Year','Genre-Year','Platform-Year']):
ax.set(title=title)
for year in years:
ax.bar(year,len(df[df['Year']==year][columns].unique()))
ax.plot(years,column,'--')
plt.show()
#결론: 1980년도 부터 해가 바뀔수록 제작사, 장르, 플랫폼의 종류 모두 증가하고 있는 것을 알 수 있다. 2000년도 전과 후로 차이가 좀 나는 것을 확인할 수 있다.
# : 2000년도 전에는 게임 개발이 저조했고 장르, 플랫폼, 제작사 모두 현재처럼 다양하지 않았기 때문에 모두 비슷한 장르를 선호했다는 것을 확인할 수 있었다.
#output
3. 결론
- 다음 분기에는 console platform(ps4,ps3,xone,wiiu etc)을 이용하고 Action, Sports, Racing과 같은 역동적인 게임을 설계하는 것이 좋을 것 같다.