
[Python] Pandas

[pandas 기초]결측치(NaN), 중복 데이터 처리
개요
이번 포스팅에서는 데이터의 결측치(NaN)와 중복 데이터를 어떻게 처리하는지에 대해서 알아보겠습니다.
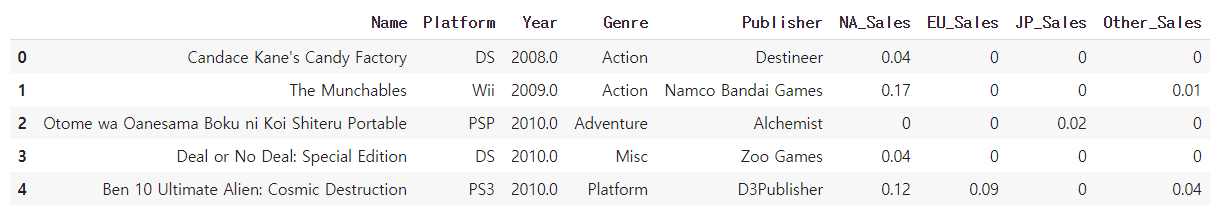
예제 데이터로는 데이터 분석 프로젝트에서 사용한 게임 데이터를 사용하겠습니다.
df = pd.read_csv('/content/drive/MyDrive/vgames2.csv')
df.head(5)
1. 결측치 처리
1-1. 데이터 탐색(info(), value_counts())
df.info()

#output
<class 'pandas.core.frame.DataFrame'>
RangeIndex: 16598 entries, 0 to 16597
Data columns (total 9 columns):
 #   Column       Non-Null Count  Dtype
---  ------       --------------  -----
 0   Name         16598 non-null  object
 1   Platform     16598 non-null  object
 2   Year         16327 non-null  float64
 3   Genre        16548 non-null  object
 4   Publisher    16540 non-null  object
 5   NA_Sales     16598 non-null  object
 6   EU_Sales     16598 non-null  object
 7   JP_Sales     16598 non-null  object
 8   Other_Sales  16598 non-null  object
dtypes: float64(1), object(8)
memory usage: 1.1+ MB
여기서 Genre 컬럼은 범주형 데이터이므로 value_counts()를 사용해서 고유값의 개수를 확인해보자. 여기서 dropna = False 옵션(default는 True)을 주면 누락 데이터(NaN)의 개수도 함께 카운트 해준다.
df['Genre'].value_counts(dropna=False)

#output
Action          3305
Sports          2341
Misc            1734
Role-Playing    1483
Shooter         1308
Adventure       1280
Racing          1243
Platform         884
Simulation       865
Fighting         847
Strategy         680
Puzzle           578
NaN               50
Name: Genre, dtype: int64
Genre 컬럼에 결측값이 50개가 있는 것을 확인할 수 있다.
1-2. 결측치 탐색(isnull(), notnull())
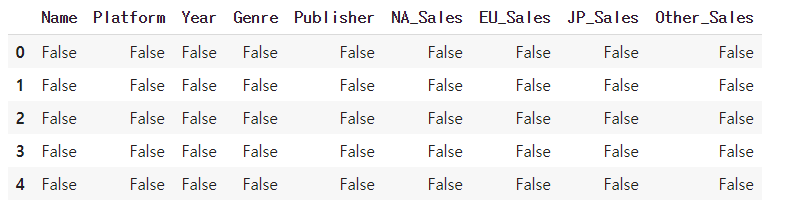
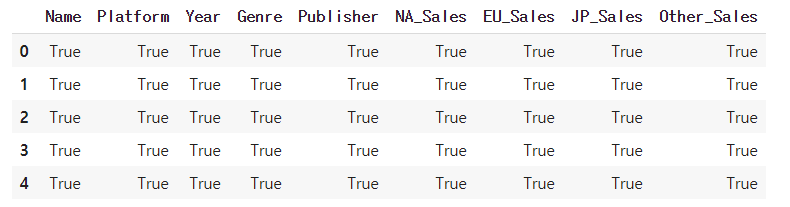
isnull()은 판다스의 시리즈 및 데이터프레임 내의 결측치를 탐색해 결측치에 대해 True를 반환해주고 notnull()은 그 반대이다.
df.head(5).isnull()
df.head(5).notnull()
여기서 컬럼별 결측치의 수를 확인하고 싶으면 파이썬 내장 함수인 sum을 다음과 같이 사용하면 된다. (df.isnull이 결측치를 true로 반환하기 때문에 sum이 true에 해당하는 데이터를 카운트해서 그 결과를 반환하게 된다.)
df.isnull().sum()
#output - 데이터프레임의 컬럼별로 결측값의 수를 반환
Name             0
Platform         0
Year           271
Genre           50
Publisher       58
NA_Sales         0
EU_Sales         0
JP_Sales         0
Other_Sales      0
dtype: int64
1-3. 결측치 제거(dropna())
아무 옵션 없이 dropna()를 사용하게 되면 결측치가 존재하는 모든 행을 삭제하게 된다.
df = df.dropna()

df.isnull.sum()
#output - 결측치가 모두 사라진 것을 확인할 수 있다.
Name           0
Platform       0
Year           0
Genre          0
Publisher      0
NA_Sales       0
EU_Sales       0
JP_Sales       0
Other_Sales    0
dtype: int64

or

df.info()
#output
<class 'pandas.core.frame.DataFrame'>
Int64Index: 16241 entries, 0 to 16597
Data columns (total 9 columns):
 \#   Column       Non-Null Count  Dtype
---  ------       --------------  -----
 0   Name         16241 non-null  object
 1   Platform     16241 non-null  object
 2   Year         16241 non-null  float64
 3   Genre        16241 non-null  object
 4   Publisher    16241 non-null  object
 5   NA_Sales     16241 non-null  object
 6   EU_Sales     16241 non-null  object
 7   JP_Sales     16241 non-null  object
 8   Other_Sales  16241 non-null  object
dtypes: float64(1), object(8)
memory usage: 1.2+ MB
axis = 1 옵션 사용
df.dropna(axis=1)
#output
<class 'pandas.core.frame.DataFrame'>
RangeIndex: 16598 entries, 0 to 16597
Data columns (total 6 columns):

 \#   Column       Non-Null Count  Dtype
---  ------       --------------  -----
 0   Name         16598 non-null  object
 1   Platform     16598 non-null  object
 2   NA_Sales     16598 non-null  object
 3   EU_Sales     16598 non-null  object
 4   JP_Sales     16598 non-null  object
 5   Other_Sales  16598 non-null  object
dtypes: object(6)
memory usage: 778.2+ KB
axis=1 옵션을 사용하게 되면 결측값이 하나라도 들어 있는 컬럼을 그냥 삭제하게 된다. 따라서 컬럼의 개수가 6개로 줄어든 것을 확인할 수 있다.
thresh=500 옵션 사용
thresh옵션을 사용하면, 예를 들어 thresh = 3이면 NaN이 아닌 값이 최소 3개 이상은 나와야 한다. 그거보다 적게 나오면 row를 제거해버린다.즉, 한 행에 10개의 컬럼 값이 있다면 그 중 3개 이상이 NaN이 아닌 값이 나와야 한다. 그렇지 않으면 그 행은 삭제된다. 만약 열을 기준으로 사용하고 싶다면 axis=1을 함께 사용하면 된다.
print(df.shape) #output: (16598, 10)
df = df.dropna(thresh = 10)
# row에 10개 이상이 NaN이 아닌 값이여야 한다.
print(df.shape) #output: (16241, 10)

해당 데이터프레임중 357개의 행이 NaN의 값을 하나라도 포함하고 있다고 볼 수 있다.
subset = [‘컬럼이름’]
데이터프레임의 ‘컬럼이름’ 열에 결측값이 1개라도 있으면 그 행을 drop한다. 동시에 주는 옵션은 ‘how’가 있는데 how = ‘any’는 default값이고 how = ‘all’로 주면 결측값이 모든 열 또는 행에 존재하면 drop하라는 의미이다.
print(df.shape) #output: (16598, 10)
df = df.dropna(subset=['Genre'])
print(df.shape) #output: (16548, 10)

해당 데이터프레임의 Genre열에 결측값이 50개가 있다는 것을 위의 결과로 확인할 수 있다.
1-4. 결측치 데이터 치환(fillna())
결측값(NaN)을 제거하지 않고 어떤 다른 값으로 대체해주는 방법이다.
fillna()의 사용을 확인해보기 위해 타이타닉 데이터를 사용하겠다.
import seaborn as sns
df = sns.load_dataset('titanic')
titanic 데이터 중 embark_town 컬럼의 데이터 분석
#embark_town 결측치 2개
df['embark_town'].isnull().sum() #output: 2

#3개의 범주형 변수로 이루어진 데이터
df['embark_town'].value_counts()
#output:
Southampton    644
Cherbourg      168
Queenstown      77
Name: embark_town, dtype: int64
평균값으로 대체
mean_age = np.mean(x)
df['age'].fillna(mean_age,inplace=True)
최빈값(주어진 자료 중 가장 많은 빈도로 나타나는 변량 또는 자료)으로 대체
2개의 결측치가 데이터프레임 내 어느 index에 있는지 확인
df.index[df['embark_town'].isnull()]
#output:
Int64Index([61, 829], dtype='int64')
2개의 결측값을 해당 컬럼의 3가지 범주중 최빈값으로 대체하는 2가지 방법
1. df['embark_town'].describe()['top']
#output: Southampton

2. df['embark_town'].value_counts(dropna=True).idxmax()
#ouput: Southampton
-
describe()[‘top’]를 사용하면 전체 데이터프레임에 대해서는 적용되지 않지만 특정 컬럼에 대해서 최빈값의 인덱스를 추출해준다.
-
idxmax()는 데이터프레임의 특정열(시리즈)에 대해서 가장 값이 큰 row의 index를 반환한다. 그래서 value_counts로 series의 형태로 반환해주고 해당 시리즈의 가장 값이 큰 row의 index를 반환된 것을 볼 수 있다.
ps)
df['embark_town'].value_counts(dropna=False)
#output: 결측값까지도 개수를 세어 보여준다. dropna=True가 default
Southampton    644
Cherbourg      168
Queenstown      77
NaN              2
Name: embark_town, dtype: int64
그럼 이제 fillna()함수를 이용해서 결측값을 최빈값으로 바꿔보자.
most_freq = df['embark_town'].describe()['top']
#most_freq = df['embark_town'].value_counts().idxmax()
index = df.index[df['embark_town'].isnull()]

#최빈값으로 대체
df['embark_town'].fillna(most_freq,inplace = True)

print(df.loc[index,'embark_town'])
#output:
61     Southampton
829    Southampton
Name: embark_town, dtype: object
이웃하고 있는 값으로 대체
method = ‘ffill’은 결측값의 바로 앞의 값으로, method = ‘bfill’은 결측값의 바로 뒤의 값으로 바꿔주는 옵션이다.
print('***치환 전***')
print(df.iloc[59:63,'embark_town'])

df['embark_town'].fillna(method='ffill',inplace=True)

print('***치환 후***')
print(df.iloc[59:63,'embark_town'])

#output
***치환 전***
59    Southampton
60      Cherbourg
61            NaN
62    Southampton
63    Southampton
Name: embark_town, dtype: object
***치환 후***
59    Southampton
60      Cherbourg
61      Cherbourg
62    Southampton
63    Southampton
Name: embark_town, dtype: object

print('***치환 전***')
print(df.iloc[59:63,'embark_town'])

df['embark_town'].fillna(method='bfill',inplace=True)

print('***치환 후***')
print(df.iloc[59:63,'embark_town'])

#output
***치환 전***
59    Southampton
60      Cherbourg
61            NaN
62    Southampton
63    Southampton
Name: embark_town, dtype: object
***치환 후***
59    Southampton
60      Cherbourg
61    Southampton
62    Southampton
63    Southampton
Name: embark_town, dtype: object
2. 중복 데이터 탐색
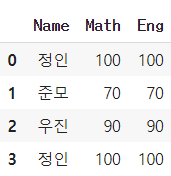
중복 데이터 탐색을 위해 사용한 데이터프레임
import pandas as pd

df = pd.DataFrame({'Name':['정인','준모','우진','정인'],'Math':[100,70,90,100],'Eng':[100,70,90,100]})
2-1. 중복 데이터 탐색(duplicated())
duplicated()함수는 row마다 중복되는 데이터를 탐색해준다. 아무 옵션을 적용하지 않으면 row마다 중복되어 있으면 True를 그렇지 않으면 False를 반환한다.
df.duplicated()
#output
0    False
1    False
2    False
3     True
dtype: bool
바로 전행과만 비교 하는 것이 아닌 처음 나오는 행인지, 나왔던 행인지를 비교한다. 결과적으로 False의 개수가 데이터프레임 내 유니크한 값의 개수이다.
당연하게도 하나의 컬럼에만 적용도 가능하다.
df['Name'].duplicated()
#output
0    False
1    False
2    False
3     True
Name: Name, dtype: bool
2-2. 중복 데이터 제거(drop_duplicated())
데이터프레임 내의 중복된 row를 제거해주는 함수이다.
df.drop_duplicated(inplace=True)
#inplace = True를 지정해주면 처리한 데이터를 바로 데이터프레임에 적용할 수 있다.
df.duplicated()
#output:
0    False
1    False
2    False
dtype: bool
subset = [‘컬럼명’,’컬러명’,….] 옵션 사용
df.drop_duplicated(subset=['Math'],inplace=True)
#Math 컬럼을 기준으로 중복되는 데이터를 갖고 있는 row를 삭제한다.
#output:
0    False
1    False
2    False
dtype: bool